I previously wrote about top- vs bottom-fermenting breweries in Germany (in particular the Northern German Brewing Tax Association), and then specifically about Prussia, Germany’s biggest state at the time, as the individual provinces were very different in how widespread bottom-fermenting breweries were.
What was still missing was the South of Germany. While I still don’t have full statistics, I at least have some numbers: full numbers of top- and bottom-fermenting breweries and respective production volumes for Bavaria and Württemberg, for Alsace-Lorraine we only have the number of breweries.
Please note that the statistics are for different time period: Bavaria’s numbers are for all of 1889, while Württemberg’s and Alsace-Lorraine’s numbers are for the fiscal year 1889/1890, i.e. 1 April 1889 until 31 March 1890. For Alsace-Lorraine we only know the total production volume (797,807 hl) not split up by top- vs bottom-fermenting, while for Baden we only have the total number of brewing vessels (1,918), their combined volume (17,198 hl), and the total production volume (1,630,976 hl), but nothing divided by top- vs bottom-fermenting.
Also, the data on Bavaria distinguishes between “brown beer brewery” and “white beer brewery”, but brown beer was equivalent with bottom fermentation, while white beer was equivalent with top fermentation.
Breweries
Production Volume [hl]
State
TF
BF
TF
BF
Bavaria
1,621
5,260
212,228
14,062,842
Württemberg
4,870
2,315
90,287
3,328,793
Alsace-Lorraine
8
150
n/a
n/a
What is very noticeable how small the top-fermenting breweries must have been: while the average bottom-fermenting Bavarian brewery would have brewed 2,673 hl, the average top-fermenting Bavarian only brewed 130 hl per year. So while there was a large number of breweries, most of them probably only brewed at slightly more than home-brew scale, probably only just serving their super local community, or the niche of white beer drinkers within it.
Even more extreme is Württemberg, where the average top-fermenting brewery only produced 18.5 hl per year, even an order of magnitude smaller than the average Bavarian brewery. That’s just 35.5 liters per week, probably only just enough for what a single pub or inn was selling in that time period. And don’t forget that these are averages, so there were likely breweries that brewed even less.
Now I wonder even more about top-fermented beer in Württemberg. Like, was it a cottage industry of small brew pubs or inns of de-facto homebrewers serving small niches of white beer drinkers? Was this something originally rooted in a farmhouse brewing culture we don’t know about yet? The statistics tell us nothing about whether any of that top-fermented beer in Württemberg was even sold or whether it was brewed for home consumption. 35.5 liters would be just enough to serve the weekly consumption of a farm, that’s about 5 Maß of beer per day.
I think there’s a lot more research that needs to be done about top-fermented beer in Württemberg in the late 19th century.
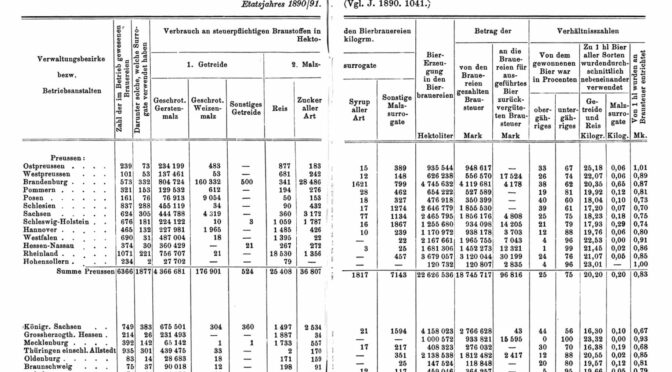
The German Brewing Tax Law of 1906, which went into effect on June 3, 1906, regulated the permissible ingredients for bottom- and top-fermented beers within the Northern German Brewing Tax Association. From that point onwards, bottom-fermented beers could only be brewed from barley malt, hops, water and yeast, while top-fermented beers could also be brewed using malt made from other grains, various sugars (beer sugar, cane sugar, invert sugar, starch sugar, caramel colouring) and sweeteners (for low-ABV beers only). But before that, beer tax laws in North Germany were much lenient (Bavarians hated that), and ingredients like rice could be used.
I won’t reproduce all the numbers here as that would be too much. But let’s look at some of the highlights:
An average beer brewed in the Northern German Brewing Tax Association in 1890/1891 would have been (by weight of ingredients):
95.75% barley malt
2.78% wheat malt
0.01% other grains
0.51% rice
0.73% sugar
0.03% syrup
0.19% other malt surrogates
The most rice was was used in Bremen (the statistics don’t include 3 export breweries) with 3.23% rice, Mecklenburg with 2.56%, and the Rhineland, with 2.38% of all ingredients used in brewing.
When it comes to brewing sugar, Brandenburg stands out with 2.85% of the total brewing ingredients by weight. They also similarly stand out for the use of wheat malt, with 16.08%. That’s probably an artifact of the Berliner Weisse brewing industry (Berlin was part of Brandenburg) which used plenty of wheat malt. The Province of Posen was number two, with 10.46%, which absolutely makes sense: the city of Grätz/Grodzisk Wielkopolski is located in that historic Prussian province, and is best known for the Grodziskie beer style which is brewed from 100% smoked wheat malt.
It’s also interesting to see what percentage of breweries even used malt surrogates of any kind (including rice, sugar, etc.) in the first place: 83.33% in Bremen, 80.65% in Lübeck, 75% in Hamburg, and 59.46% in Anhalt. On the other end, where malt surrogates were used the least, are these places: Hohenzollern (0.85%, just 2 out of 234 breweries), Westphalia (4.49%), Province of Hesse-Nassau (8.02%) and Grand Duchy of Hesse (12.15%).
In the same statistics, we also get more insight into the distribution of top- vs bottom-fermenting brewing: the top places for bottom fermentation (in terms of production volume) in Northern Germany in 1890/1891 were:
Grand Duchy of Hesse, 100% bottom fermentation
Province of Hesse-Nassau, 99% bottom fermentation
Westphalia, 96% bottom fermentation
Brunswick, 95% bottom fermentation
Conversely, the top places where top fermentation still held on were:
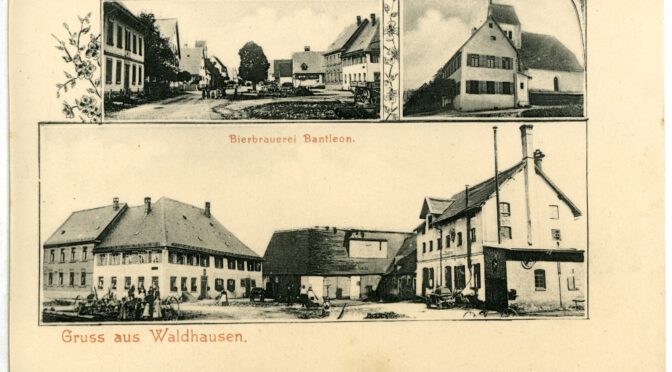
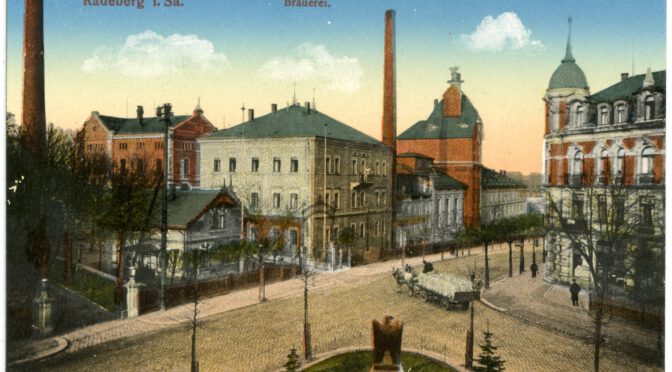
On my visit to the National Archives in Kraków, I came across quite a bit of material related to Johann Götz and his breweries. So who’s Johann Götz anyway, and what makes his breweries relevant?
Johann Evangelist Götz, or Jan Ewangelista Götz (sometimes spelled Goetz) as he’s called in Polish, was born in 1815 in Langenenslingen in modern-day Baden-Württemberg. Coming from a family of brewers, he was hired as a cellar master in 1837 at the Kleinschwechater brewery by Anton Dreher, who happened to be his cousin. After 1.5 years, he was promoted to brewery foreman and Dreher’s personal assistant. He was closely involved in brewing the first “real” Kleinschwechater Lager in 1840, and has been credited with improved the quality of the beer as well as the brewery’s overall efficiency. He was an important figure in the history of Vienna Lager, but his stint at Kleinschwechat was relatively short, as he moved to Galicia in 1845 where he co-founded the Okocim brewery not far from Kraków.
At a time when bottom-fermentation was still only catching on in Vienna and bakers started to feel a lack of availability of barm (brewer’s yeast, skimmed from fermenters of top-fermented beers), he went to the easternmost realms of the Austrian Empire and started a new, industrial brewery using the techniques he helped develop and perfect together with Anton Dreher. In doing so, he was (to my knowledge) the first one to establish a lager brewery in partitioned Poland.
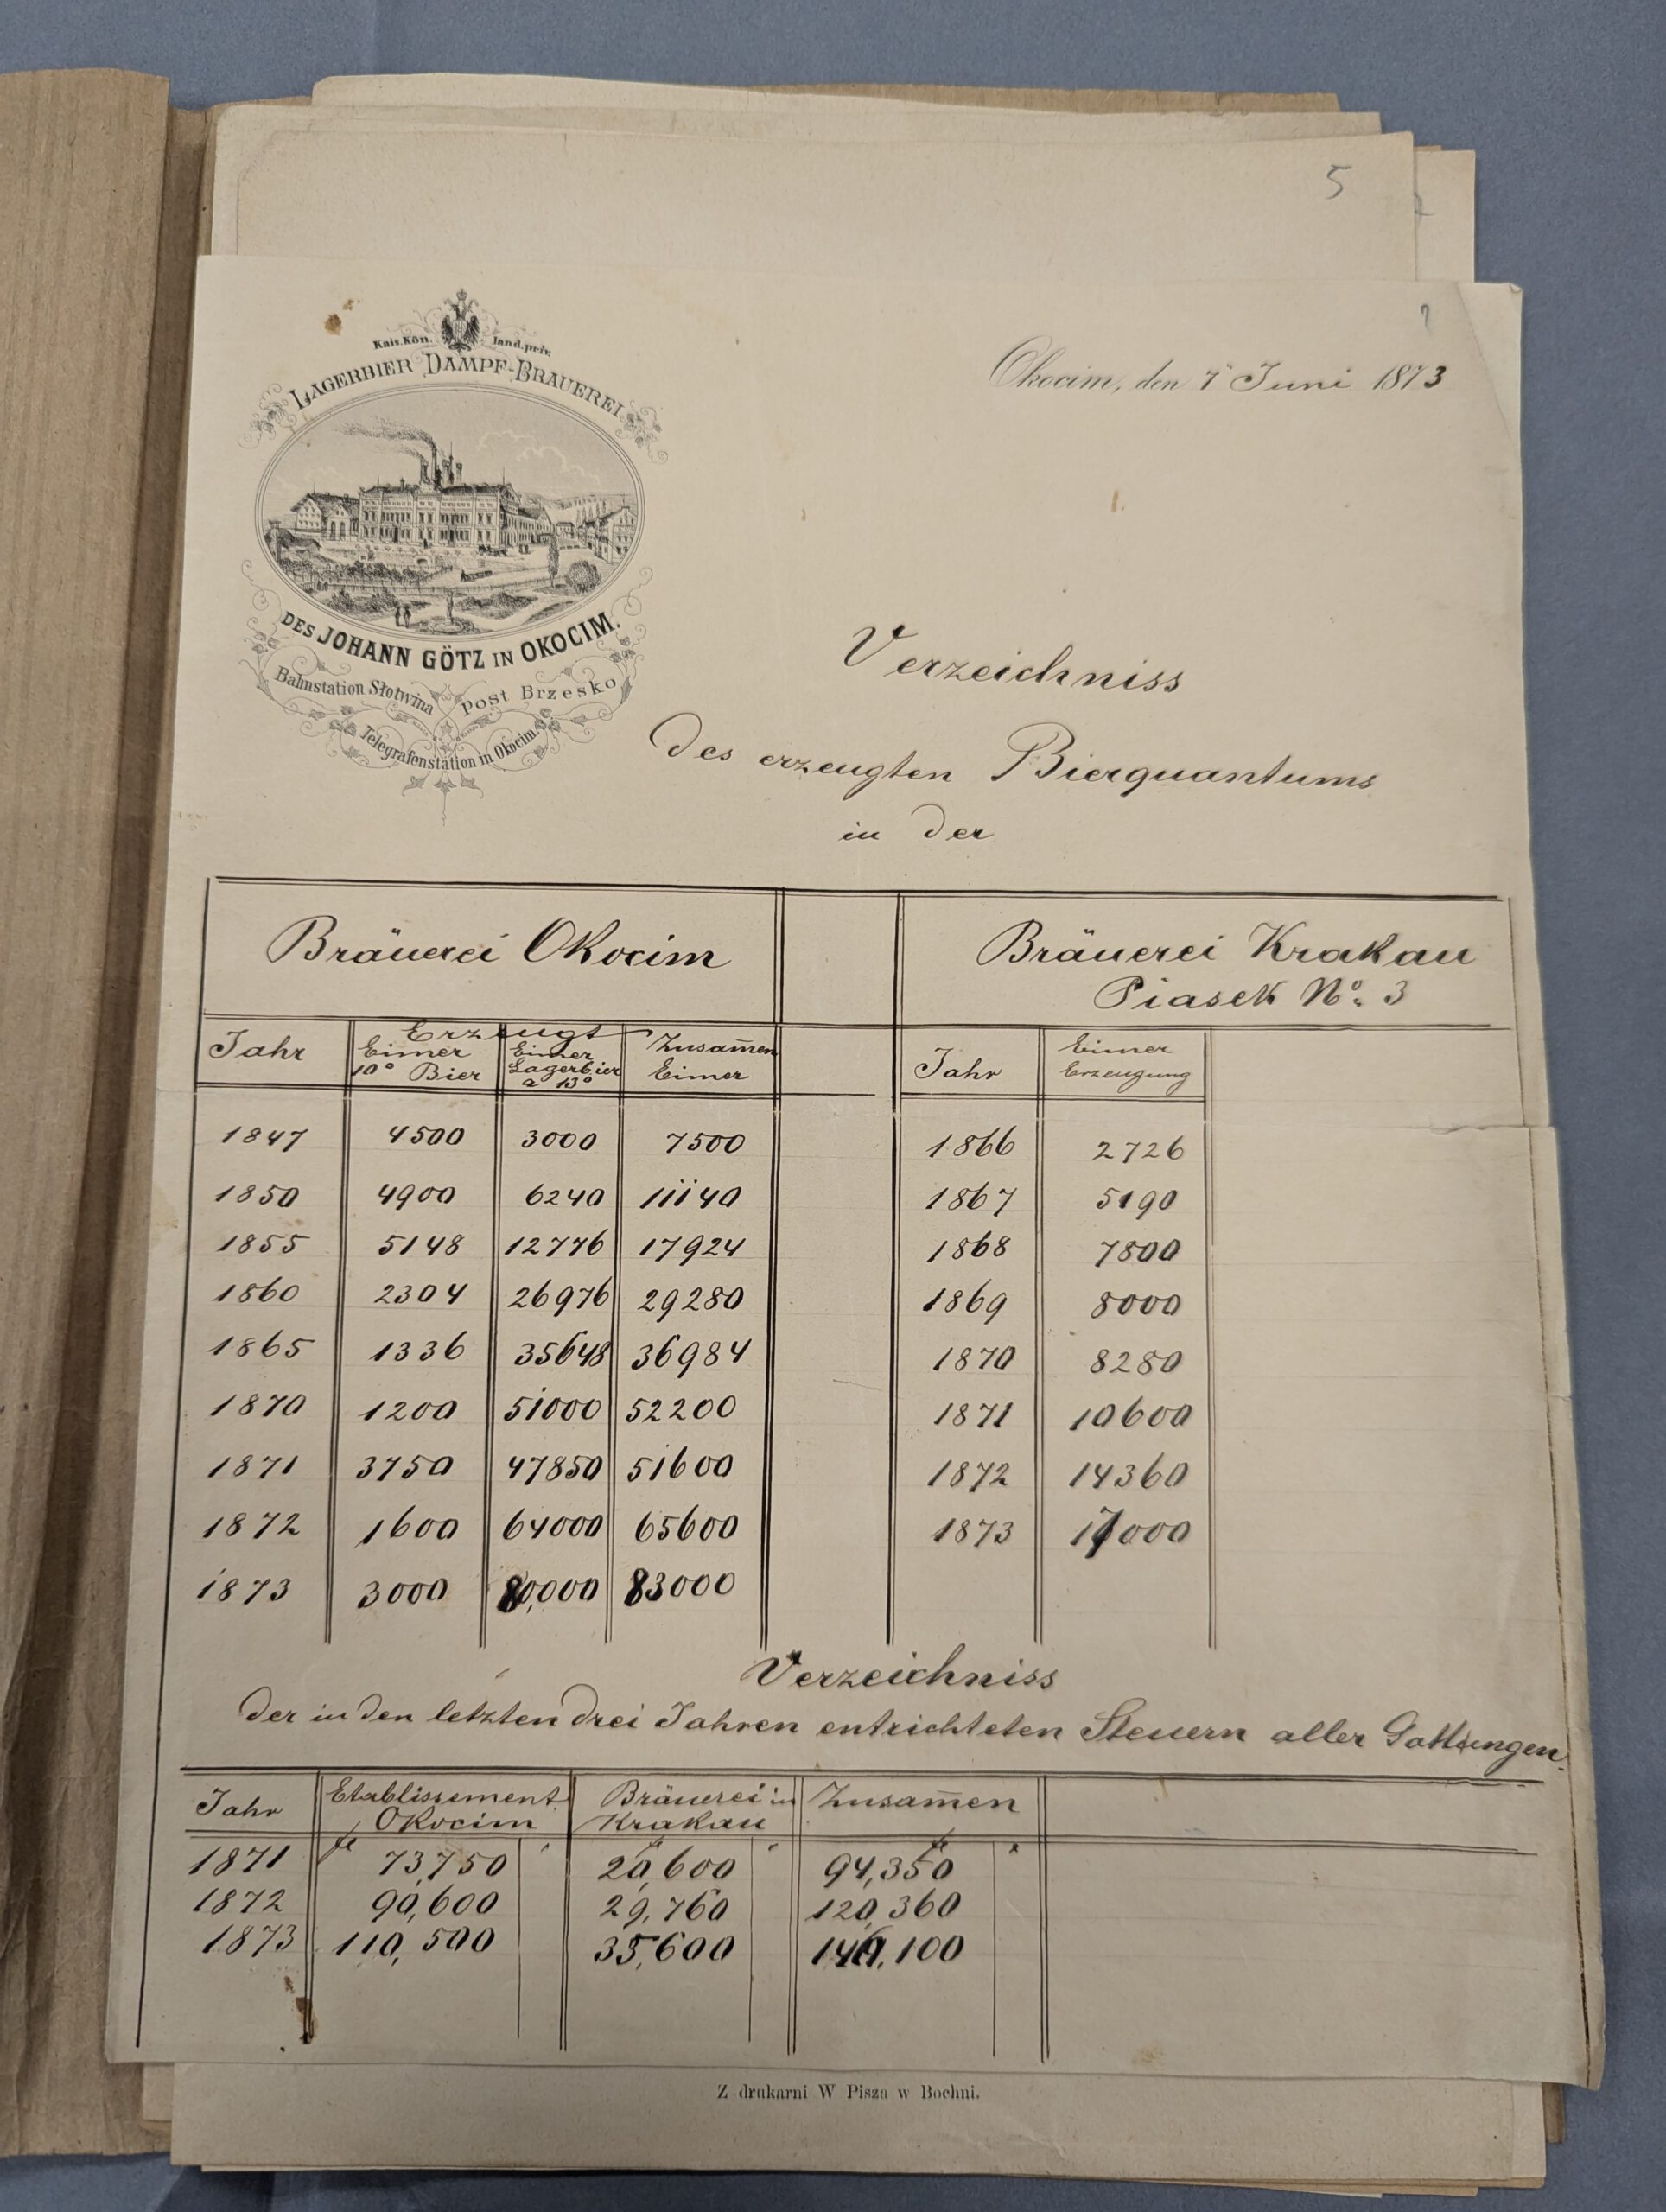
Besides the brewery in Okocim, he also started another brewery in Kraków, in the Piasek district. One find I was very happy about when I went through the material in the National Archives was a German-language hand-written list of production statistics for both breweries. Though they were not quite complete for all years, they still give us great insight into the overall development and growth of both breweries.
Here are the statistics for the Okocim brewery by year. All amounts are in Eimer. One Eimer equals 56.589 liters, or about 0.566 hl. I added the equivalent hl in parentheses.
Year
10° Beer
13° Lager Beer
Combined
1847
4,500 (2,546)
3,000 (1,698)
7,500 (4,244)
1850
4,900 (2,773)
6,240 (3,531)
11,140 (6,304)
1855
5,148 (2,913)
12,776 (7,230)
17,924 (10,143)
1860
2,304 (1,304)
26,976 (15,265)
29,280 (16,569)
1865
1,336 (756)
35,648 (20,173)
36,984 (20,929)
1870
1,200 (679)
51,000 (28,860)
52,200 (29,539)
1871
3,750 (2,122)
47,850 (27,078)
51,600 (29,200)
1872
1,600 (905)
64,000 (36,217)
65,600 (37,122)
1873
3,000 (1,698)
80,000 (45,271)
83,000 (46,969)
One interesting detail here is how the brewery produced both a 10° beer and a 13° beer (the degrees refer to the original gravity in Balling). This is something we know from Anton Dreher’s brewery, where these two beer strengths were the two main beers brewed at least until the 1890s. Distinguishing beers by OG is also still common in Czechia, though the main strengths there are more commonly 10° and 12°.
It is noticeable though that while the 10° beer was a relatively large share of the overall production in early years, it never grew beyond slightly more than 5,000 Eimer per year, and within 26 years the share of 10° beers in the overall production volume shrank from 60% to just 3.75%. I guess lower-strength beers weren’t particularly popular among Poles at the time…
In the same document, we also get statistics for Götz’s brewery in Kraków. Again the amounts are in Eimer, which the equivalent hectoliter in parentheses next to it.
Year
Amount
1866
2,726 (1,542)
1867
5,190 (2,937)
1868
7,800 (4,414)
1869
8,000 (4,527)
1870
8,280 (4,685)
1871
10,600 (5,998)
1872
14,360 (8,126)
1873
17,000 (9,620)
Clearly, the Kraków brewery was producing at a much smaller scale. But still, at a combined 100,000 Eimer (56589 hl) for 1873, this was a sizeable brewing operation divided between locations.
The hand-written production statistics of the Götz-owned breweries in Okocim and Kraków, in German
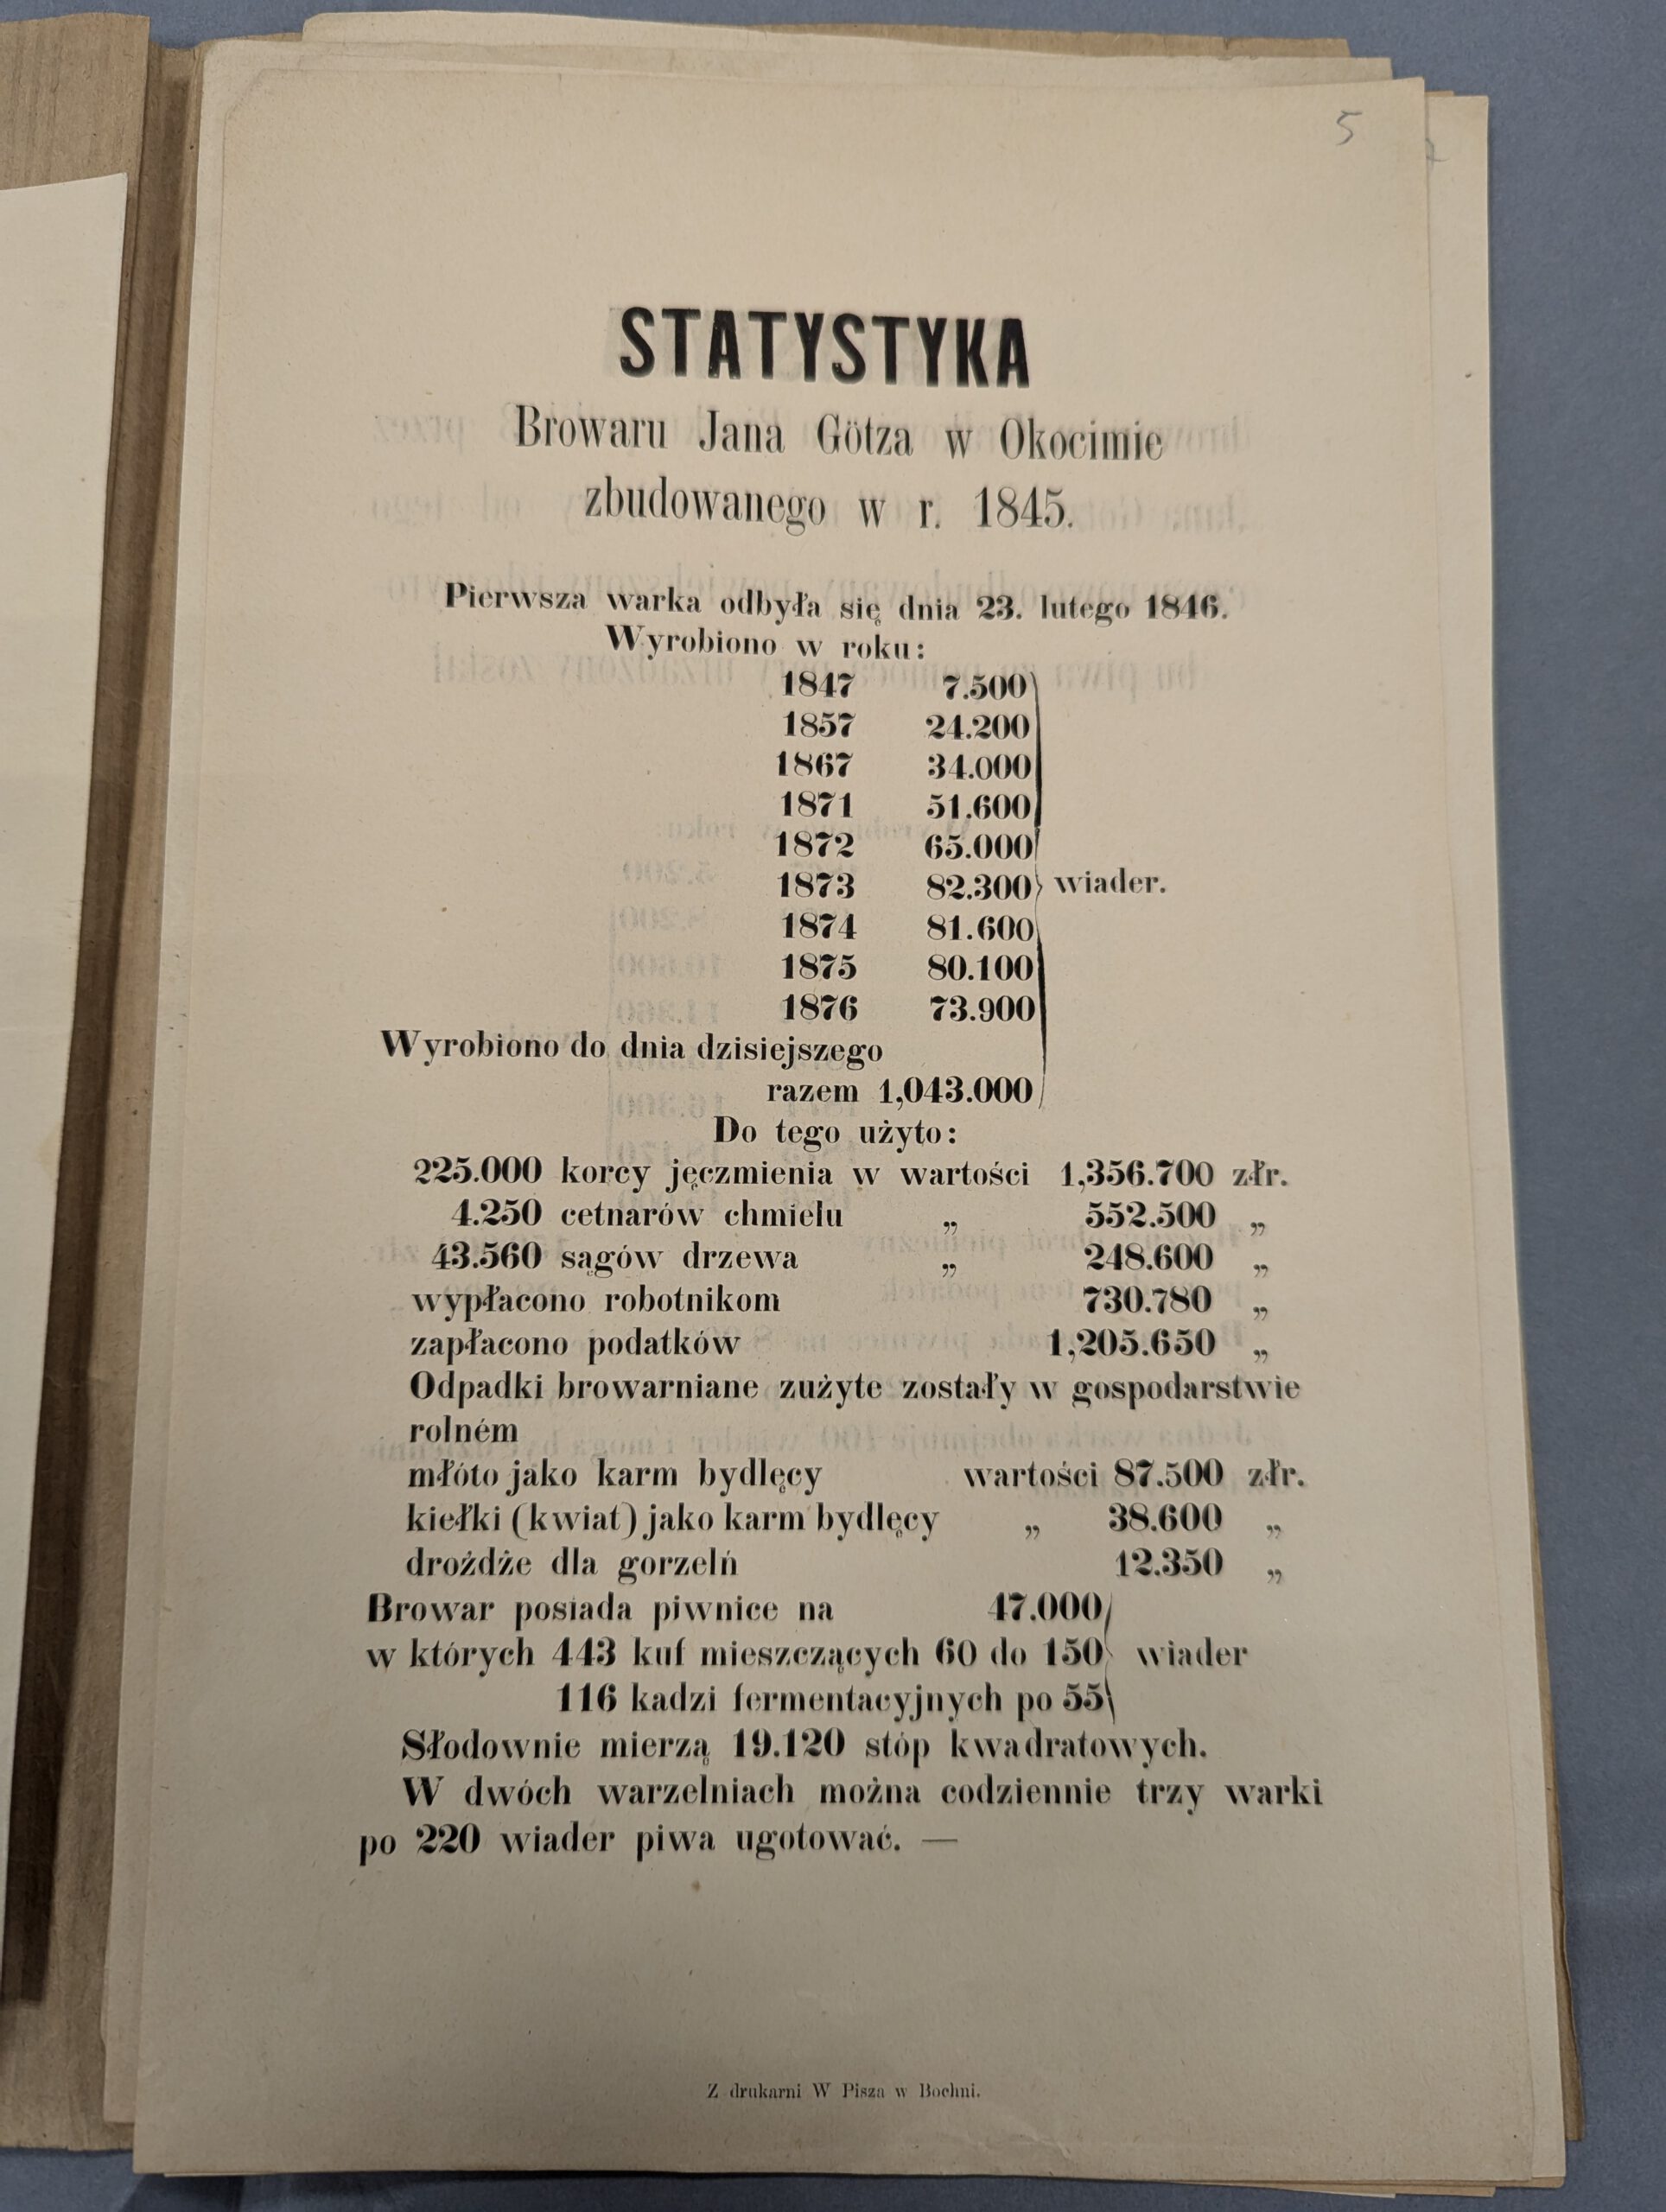
I then also came across printed statistics (in Polish) from a few years after that lists production statistics up to 1876, plus many more details about the equipment and capacity of the Okocim brewery:
Year
Amount
1847
7,500 (4,244)
1857
24,200 (13,694)
1867
34,000 (19,240)
1871
51,600 (29,200)
1872
65,000 (36,783)
1873
82,300 (46,573)
1874
81,600 (46,177)
1875
80,100 (45,328)
1876
73,900 (41,819)
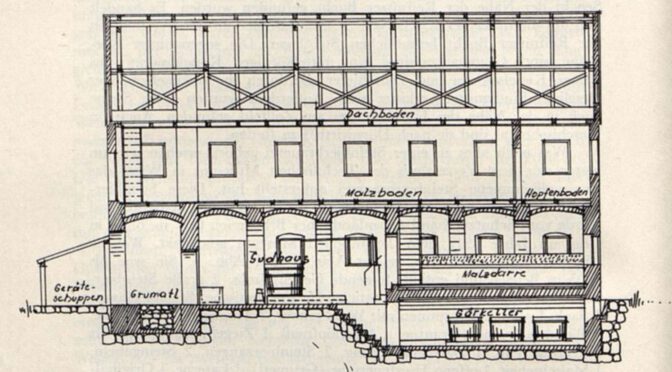
In addition to that, we learn more about the brewery capacity: the malting floor had a size of 19,120 square foot (the foot used was probably the Wiener Fuß of about 316mm). The brewery had two brew houses, each of which could produce 3 turns of 220 Eimer each per day, so a theoretical capacity of up to 1,320 Eimer (747 hl) per day in total. Fermentation happened in 116 vats with a capacity of 55 Eimer each, while the lagering cellar held 443 lagering casks of 60 to 150 Eimer each, for a combined total of 47,000 Eimer of beer that could be lagered at once.
Leaflet with statistics about the Okocim brewery, in Polish
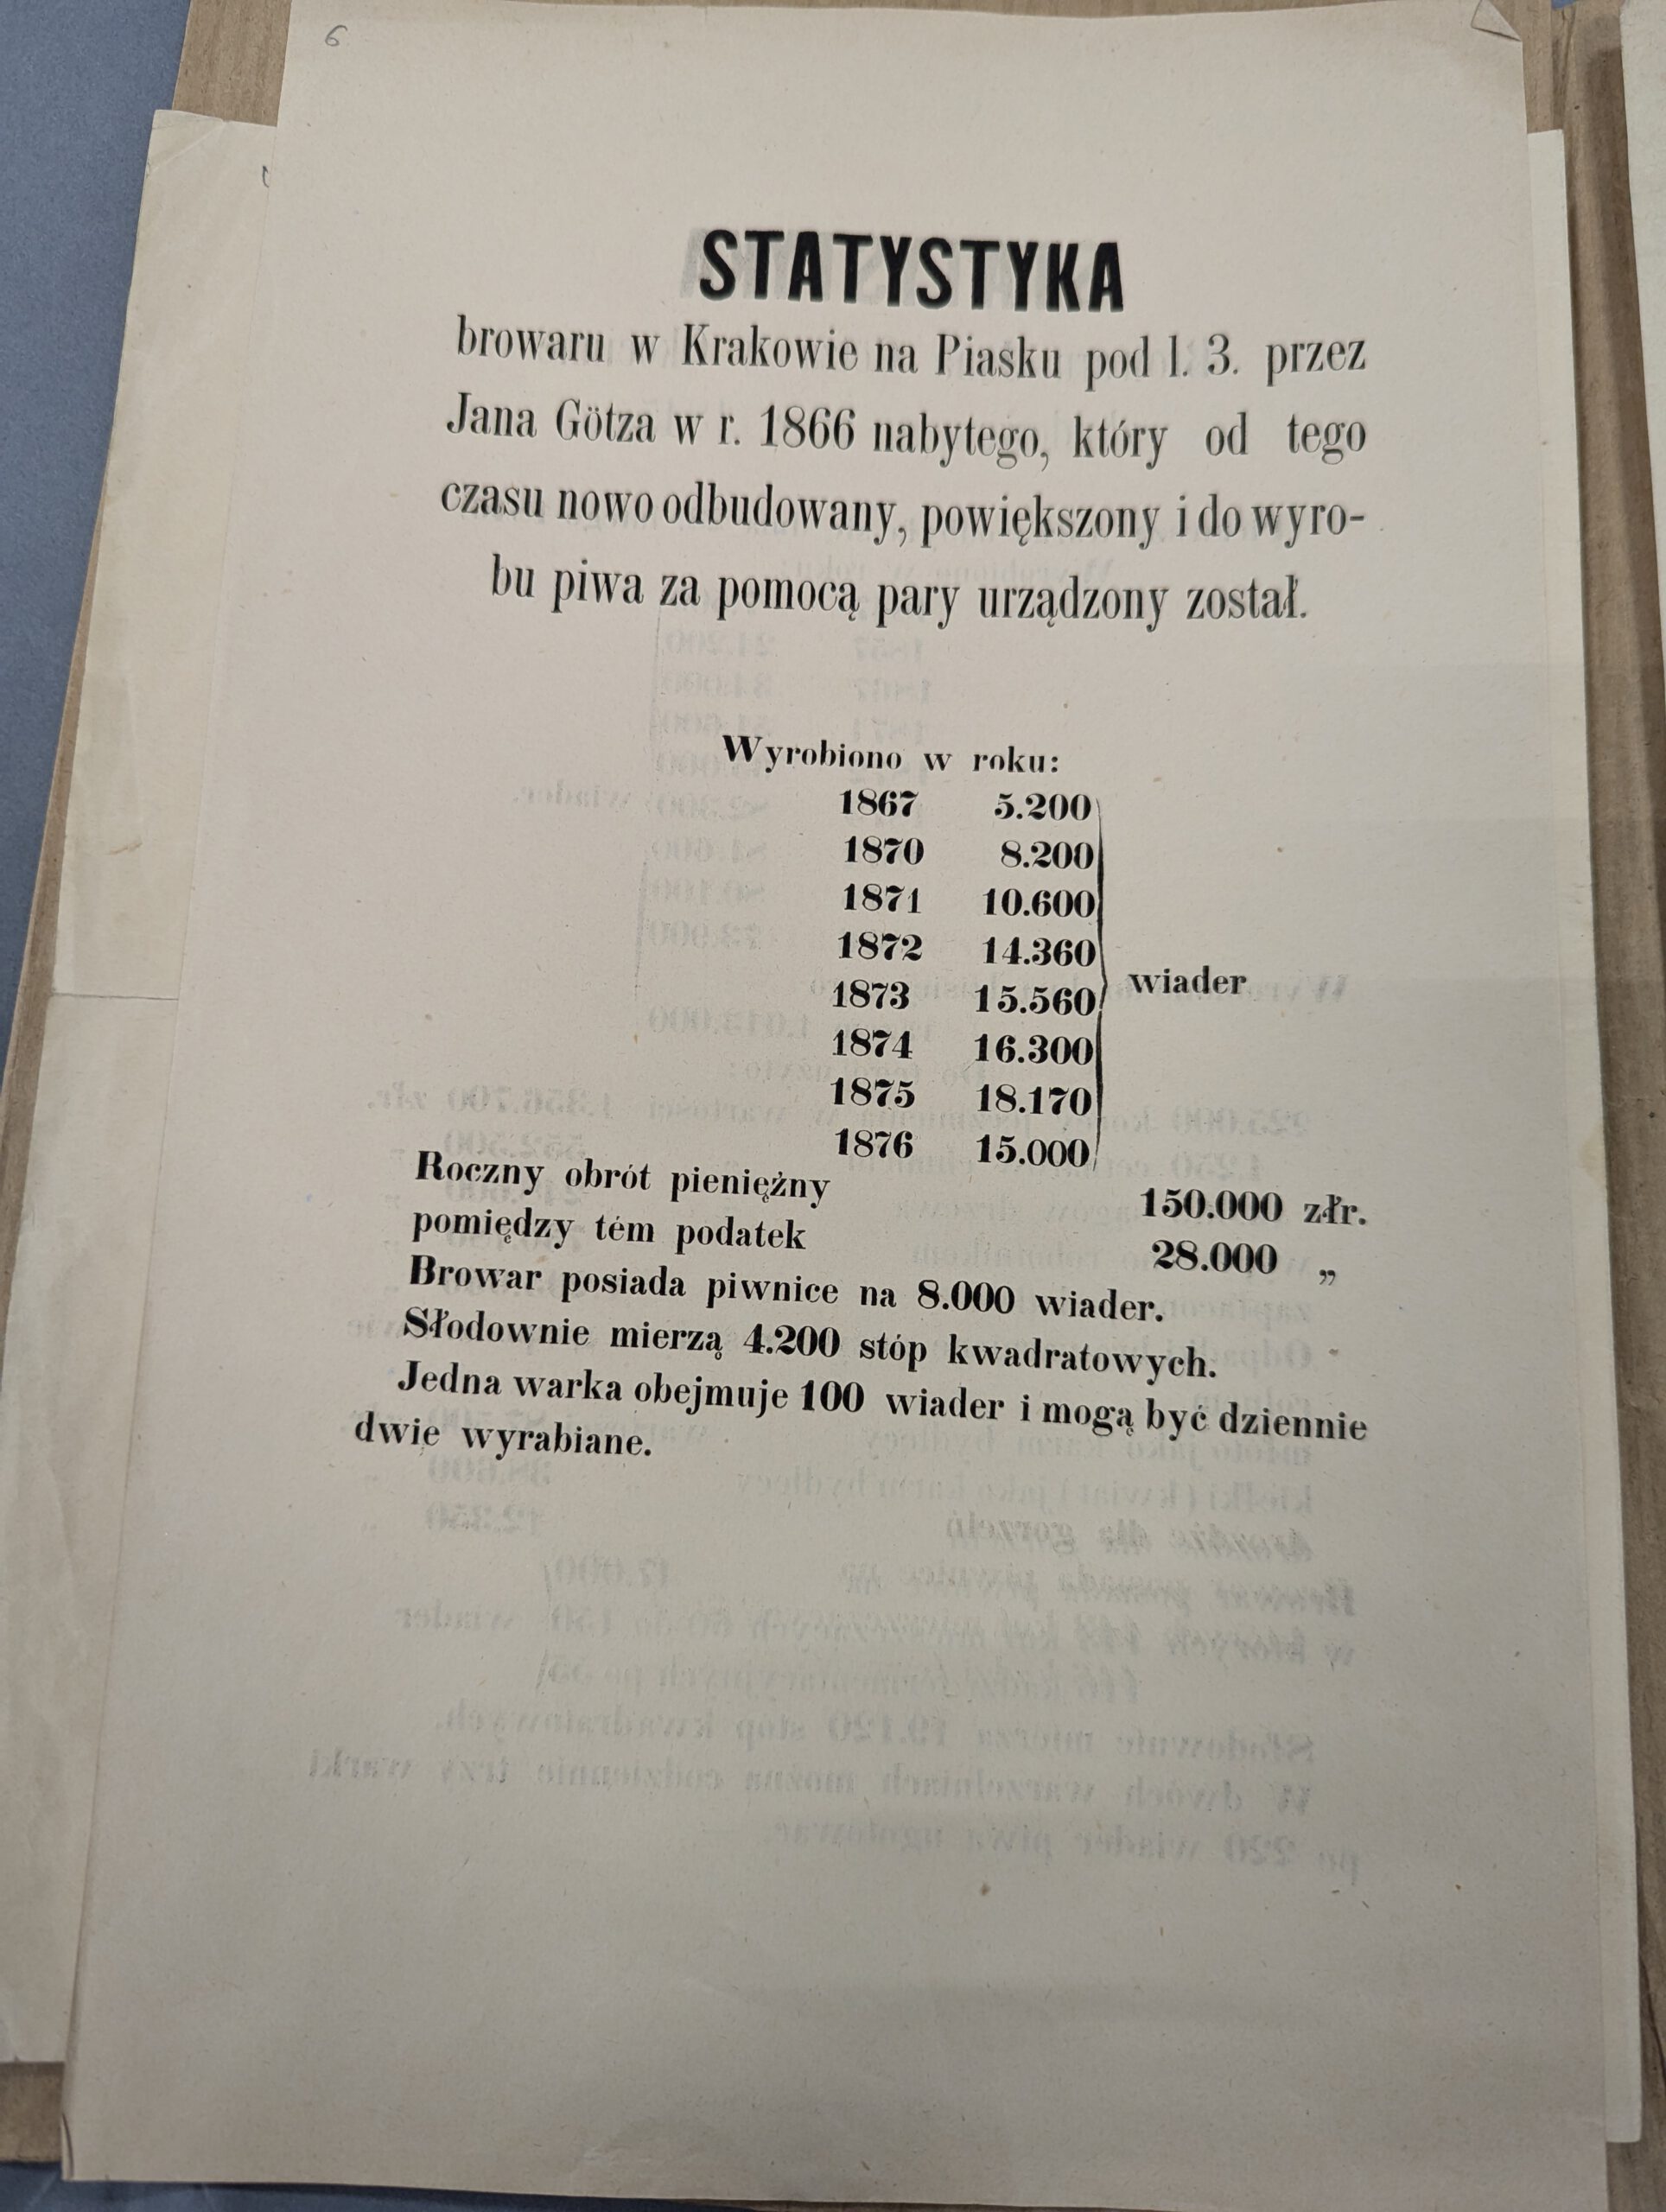
And similar information the branch in Kraków:
Year
Amount
1867
5,200 (2,943)
1870
8,200 (4,640)
1871
10,600 (5,998)
1872
14,360 (8,126)
1873
15,560 (8,805)
1874
16,300 (9,224)
1875
18,170 (10,282)
1876
15,000 (8,488)
Both malt house and brew house were considerably smaller there: the malting floor only had a size of 4,200 square foot, and only one brewing system was in place that could produce 100 Eimer per turn, with up to 2 turns per day. The lagering capacity was also significantly smaller, with only 8,000 Eimer.
Leaflet with statistics about the Götz brewery in Kraków, in Polish
In my recent article about top- vs bottom-fermenting breweries in Germany 1889/1890, I simplified one bit of the data: I lumped together all provinces of Prussia, when the data was actually much more detailed specifically for that state.
So let’s start with the per-province data:
Breweries
Production volume [hl]
No.
Province
TF
BF
TF
BF
1
East Prussia
199
52
328,721
582,580
2
West Prussia
42
60
172,278
419,883
3
Brandenburg
444
125
1,839,780
2,876,476
4
Pomerania
235
82
126,654
531,615
5
Posen
113
51
218,544
270,509
6
Silesia
654
199
1,128,173
1,534,086
7
Saxony
465
174
646,987
1,791,947
8
Schleswig-Holstein
653
53
282,954
952,226
9
Hanover
355
110
155,436
1,001,521
10
Westphalia
468
248
101,883
2,000,935
11
Hesse-Nassau
90
312
28,404
1,613,806
12
Rhineland
783
371
1,030,283
2,527,309
13
Hohenzollern
93
146
4,659
117,557
List of provinces, with the number of breweries (TF = top-fermenting, BF = bottom-fermenting) and respective production volumes
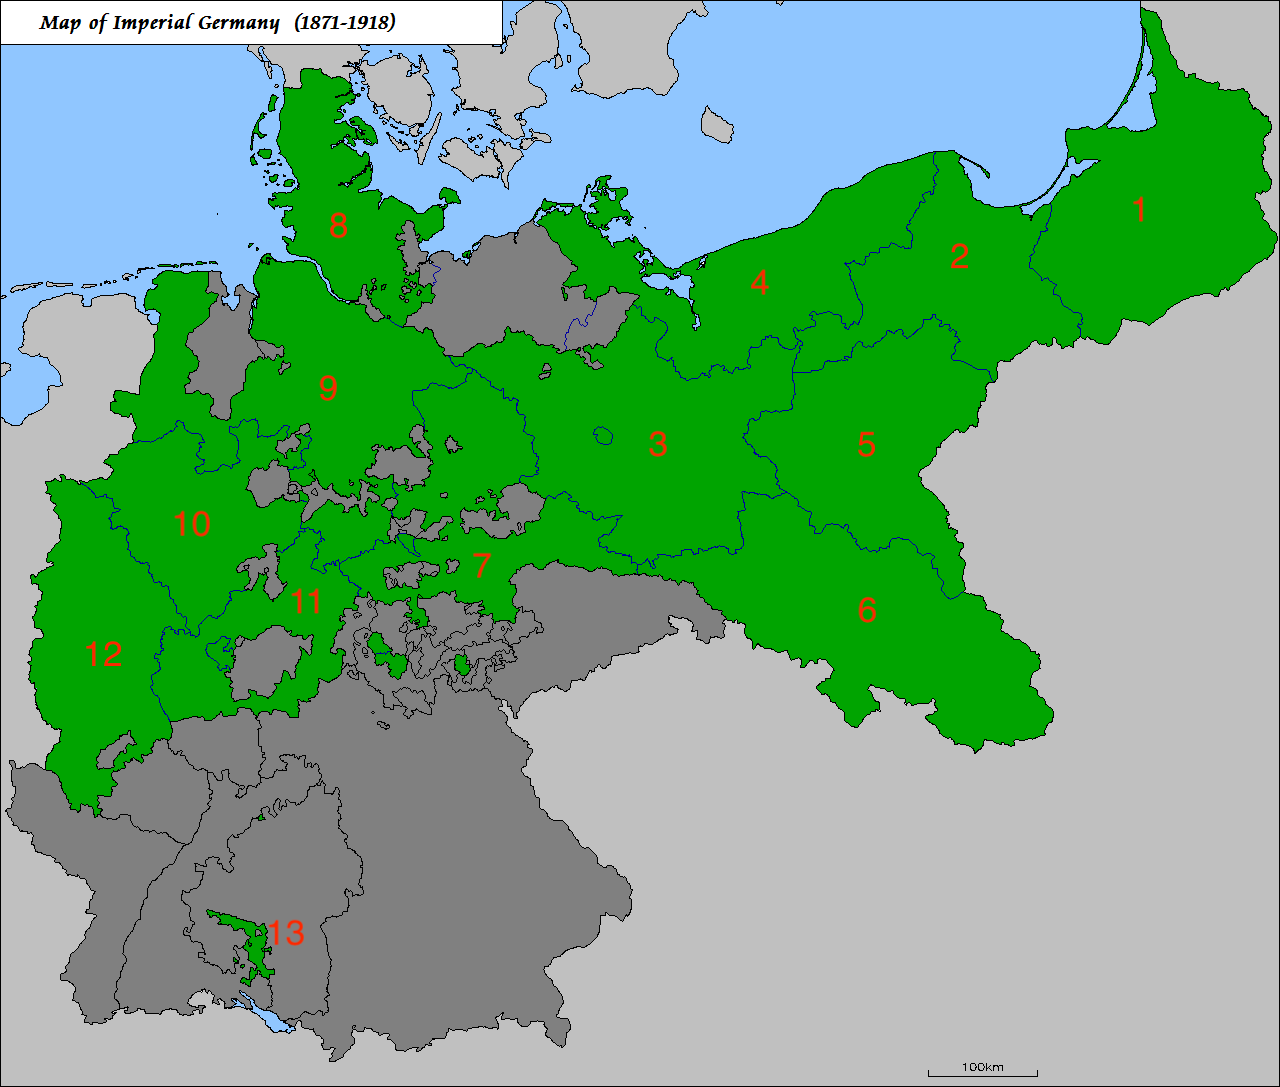
I added numbers to give you a better idea where each of these provinces were located using this map:
Map of Imperial Germany, with Prussia marked green and the Prussian provinces number 1-13. This map was created using this map. Licensed under CC BY-SA 3.0. The original map was created by Maps & Lucy and others.
Now let’s again look at the ratio of bottom- to top-fermenting breweries per province:
No.
Region
BF / TF
1
East Prussia
0.26
2
West Prussia
1.43
3
Brandenburg
0.28
4
Pomerania
0.35
5
Posen
0.45
6
Silesia
0.30
7
Saxony
0.37
8
Schleswig-Holstein
0.08
9
Hanover
0.31
10
Westphalia
0.53
11
Hesse-Nassau
3.47
12
Rhineland
0.47
13
Hohenzollern
1.57
List of the provinces and the ratio of bottom- to top-fermenting breweries in each of them
The first thing I noticed is that there are only three provinces with more bottom-fermenting than top-fermenting breweries: West Prussia, Hesse-Nassau and Hohenzollern. When you look at the raw data, West Prussia in general didn’t seem to have too many breweries in the first place. Hesse-Nassau, just like the State of Hesse (which it fully surrounds), also seems to have switched over to bottom fermentation, but not quite to the extent as Hesse. And then there’s Hohenzollern, which is actually quite separate from the rest of Prussia and located very much in the South of Germany where bottom fermentation has a more longstanding tradition.
This brings me to the next table of statistics, the average production volumes per province, divided between top- and bottom-fermenting breweries:
hl / Brewery
No.
Region
TF
BF
BF / TF
1
East Prussia
1,651.86
11,203.46
6.78
2
West Prussia
4,101.86
6,998.05
1.71
3
Brandenburg
4,143.65
23,011.81
5.55
4
Pomerania
538.95
6,483.11
12.03
5
Posen
1,934.02
5,304.10
2.74
6
Silesia
1,725.04
7,708.97
4.47
7
Saxony
1,391.37
10,298.55
7.40
8
Schleswig-Holstein
433.31
17,966.53
41.46
9
Hanover
437.85
9,104.74
20.79
10
Westphalia
217.70
8,068.29
37.06
11
Hesse-Nassau
315.60
5,172.46
16.39
12
Rhineland
1,315.81
6,812.15
5.18
13
Hohenzollern
50.10
805.18
16.07
The list of Prussian provinces, each with the average hl / Brewery for top- and bottom-fermenting breweries, plus the ratio of bottom- to top-fermenting average production volume.
Hohenzollern absolutely stands out here, with just tiny average production volumes. Whatever top-fermenting breweries existed there, they must have been pretty small in operation (at least on average), some of them probably glorified home-brewing operations. But even the bottom-fermenting breweries were really small compared to all the other provinces.
The brewery structure of Hohenzollern (but this is just an educated guess) was probably closer to regions like Franconia, where a lot of small, local breweries were established and just served a very local market, with relatively little industrialisation at the time.
Brandenburg (which includes Berlin) seems to have been the exact opposite, not only because it had a fairly strong top-fermenting brewing industry with a pretty large number of breweries and strong average production volumes, but also had by far the largest production volumes for bottom-fermenting breweries. These number probably mostly reflect the Berlin brewing industry: a large number of breweries making Berliner Weisse and other top-fermented beers for a market that is strong but slowly declining on the one hand, and large, industrial breweries specifically founded and built for brewing fashionable bottom-fermented beers on the other hand.
Interestingly, the Rhineland, nowadays very well known for its hyperlocal top-fermented beer cultures of Kölsch (in Cologne and surrounding areas) and Altbier (in Düsseldorf and the Lower Rhine region), does not particularly stand out as much as I would have expected. While it is the province with the third-largest total production volume of top-fermented beers in Prussia, when ranked by average production volume per brewery, it can only be found on seventh place. When looking at total bottom-fermented volume, the Rhineland is even number 2 of all provinces, but at the same time also has by far the largest number of bottom-fermenting breweries, which brings down the average production volume a lot.
It does show though that in the Rhineland, beer was an important product with presumably one of the highest per-capita consumption in all of Prussia. At least the large number of breweries would suggest a focus on the local market and a comparatively less consolidated beer market overall.
I found it interesting because these statistics gave some insight into how prevalent bottom fermentation had become in some states, and which states’ breweries managed to brew on a larger scale than others.
So here are the raw numbers:
Breweries
Production Volume [hl]
State
TF
BF
TF
BF
Prussia
4,594
1,983
6,064,756
16,220,485
Saxony
583
172
1,987,481
2,393,978
Hesse
17
210
1,097
998,493
Mecklenburg
351
46
129,254
412,878
Thuringia
345
656
323,738
2,131,323
Oldenburg
70
17
33,493
145,443
Braunschweig
43
34
25,498
450,966
Anhalt
55
18
95,406
316,109
Lübeck
26
6
38,498
105,175
Bremen
8
10
23,389
210,752
Hamburg
20
10
266,661
743,176
List of states, with the number of breweries (TF = top-fermenting, BF = bottom-fermenting) and respective production volumes
Now let’s look at the ratio of bottom- to top-fermenting breweries per state:
State
BF / TF
Prussia
0.43
Saxony
0.30
Hesse
12.35
Mecklenburg
0.13
Thuringia
1.90
Oldenburg
0.24
Braunschweig
0.79
Anhalt
0.33
Lübeck
0.23
Bremen
1.25
Hamburg
0.50
List of the states and the ratio of bottom- to top-fermenting breweries in each of them
What’s very noticeable is that there are only three states with more bottom- than top-fermenting breweries: Hesse, Thuringia and Bremen. Hesse stands out especially because are over 12 times more bottom-fermenting breweries than top-fermenting breweries. Interestingly, most states still had a relatively large number of top-fermenting breweries. But once we look at the average production volumes per brewery of top- vs bottom-fermenting breweries, we’re getting a different picture:
hl / Brewery
State
TF
BF
BF / TF
Prussia
1,320.15
8,179.77
6.20
Saxony
3,409.06
13,918.48
4.08
Hesse
64.53
4,754.73
73.68
Mecklenburg
368.25
8,975.61
24.37
Thuringia
938.37
3,248.97
3.46
Oldenburg
478.47
8,555.47
17.88
Braunschweig
592.98
13,263.71
22.37
Anhalt
1,734.65
17,561.61
10.12
Lübeck
1,480.69
17,529.17
11.84
Bremen
2,923.63
21,075.20
7.21
Hamburg
13,333.05
74,317.60
5.57
A list of states, each with the average hl / Brewery for top- and bottom-fermenting breweries, plus the ratio of bottom- to top-fermenting average production volume.
Very clearly, bottom-fermenting breweries were producing significantly more beer on average than top-fermenting breweries, across the board.
Again, the most noticeable is Hesse, but for a different reason: their average production volume per top-fermenting brewery is just 64 hl. Given that the number of top-fermenting breweries was tiny to begin with, this looks as if the last few remaining top-fermenting breweries were glorified home-breweries, not unlike what we had with Carinthian Steinbier in the decades before its demise.
The only state where top-fermenting brewing was still relatively strong was Hamburg, as it’s the only one with an average 5-digit hl production volume.
The main takeaway from these statistics is certainly that even though bottom-fermenting breweries were generally more industralised and at a more modern technical level with the capabilities to produce larger volumes of beer, many of the less mechanised top-fermenting breweries still seem to have hung around for a while. Unfortunately, these statistics don’t give any insight into what beer styles were brewed. A lot of them may still have been the old local beer styles.
I now found concrete data about how much Steinbier was brewed in the last few years of this style’s existence. Fairly detailed data from 1904 to 1917 (with the exception of 1907-1908) about the production volumes of Carinthian breweries were published in trade journals at the time.
The last three remaining breweries were Ure and Kaschitz, both located in Waidmannsdorf, nowadays part of the Carinthian capital Klagenfurt, and Schorn, from Untergoritschitzen near Klagenfurt.
Production volumes of breweries Ure, Kaschitz and Schorn, 1903-1906, 1906-1917
As you can clearly see in the numbers, before Steinbier brewing ended, it was on an almost steady decline over the course of 13 years. For 1917, the records say that production at Ure and Schorn was shut down, while Kaschitz had produced a mere 52 hectoliters.
Of these breweries, all brewed Steinbier with an original gravity of 6°, with the exception of Wedenig, who brewed a 4° Steinbier.
This low original gravity of Steinbier also seems to show (although not explicitly stated, so this is slight speculation) in the 1889/1890 brewing season beer volume statistics of Austria-Hungary by original gravity: 6° beer was the lowest OG listed, with a production volume of 2,587 hl (which is roughly in the ball park what all the Steinbier breweries together used to brew in a year), and that number is significantly higher than the next stronger beers: of 7° beer, just 49 hl, and of 8° beer, just 102 hl.
In any case, the production volumes are tiny, the numbers are going down, all clear signs of a declining “industry” that was really closer to homebrewing, serving what was probably a tiny market of aging consumers. Despite the fact that brewing stopped because of a lack of ingredients during World War 1, the tiny volumes were probably a big contributor to not resuming brewing after the war.
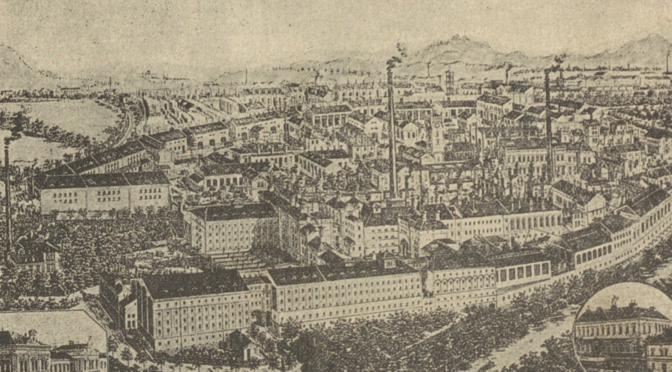
While researching a different topic, I recently came across an article in the Austro-Hungarian Café and Inn Newspaper (it really rolls off the tongue, doesn’t it?) that I hadn’t seen before. It basically contains general information about the size and the operation of both the breweries belonging to Anton Dreher (in particular Kleinschwechat, Steinbruch, Michelob and Trieste) and the Burghers’ Brewery in Pilsen (since 1898 and nowadays better known as Pilsner Urquell). It’s full of numbers, but because they’re from the same time period, they allow for some interesting comparisons about the extent of the businesses.
In terms of production, the largest brewery was of course Dreher Kleinschwechat, with about 610,000 hl for the brewing season 1892/1893. Pilsen on the other hand brewed 522,270 hl in the same time period. Dreher’s Hungary-based brewery in Steinbruch brewed another 400,000 hl, while for the other two Dreher breweries, no volumes are listed. It shows to what a large operation the Pilsner brewery had grown, while Dreher’s advantage was having multiple large breweries across Austria-Hungary that were all serving different markets.
As for the malting and brewing operation itself, there were some stark differences: Kleinschwechat had about 23,000 m2 in malting floors as well as 14 kilns, Steinbruch had 10,788 m2 with 7 kilns, while Trieste only operated a single kiln. Practically, most of its malt was actually produced in Kleinschwechat and shipped down to Trieste. The malting capacity of Michelob was not listed. Pilsen did well with “just” 9,000 m2 of malting floor and 10 kilns.
When it came to brewing itself, Kleinschwechat featured 3 coppers for boiling wort, 4 mash tuns, 4 coppers (mash kettles) for boiling mash, and 4 lauter tuns. The wort was cooled on a total of 29 copper coolships of a total surface area of 2,500 m2.
Steinbruch operated 8 coppers (presumably smaller ones than in Kleinschwechat) and 11 coolships of 698 m2.
Pilsen on the other hand had 5 separate brew houses: the original one with 1 copper and 1 mash tun (since no dedicated mash kettles or lauter tuns were listed, I assume the copper was used for boiling decoctions and the mash tun also functioned as lauter tun), one built in 1852 with 1 copper and 1 mash tun, then the third brew house built in 1862 and extended twice in 1872 and 1874, with a total of 6 coppers and 6 mash tuns, and then two more brew houses, built in 1888 and 1894, with 2 coppers and 2 mash tuns each. That’s a total of 12 coppers and 12 mash tuns. Cooling operations were supported by 22 iron coolships.
In the fermentation cellar, Kleinschwechat had 2,000 fermenters with a total capacity of 40,000 hl, Steinbruch 1,200 fermenters with 30,000 hl capacity, and Trieste just 210 fermenters of an average size of 30 hl, adding up to 6,300 hl. Pilsen operated 2,000 fermenters, but no volume is listed.
One thing though where Pilsen absolutely excelled the Dreher breweries was the number of beer wagons: while Kleinschwechat owned and operated 60 of them, and Steinbruch 20, Pilsen had much more capacity for export with a whopping 132 beer wagons. With the improved train connectivity of Pilsen since the 1860s (the article specifically cites the 1862 opening of the Bohemian Western Railway that connected Pilsen to Prague by train), it could ship its beer all over Europe and beyond.
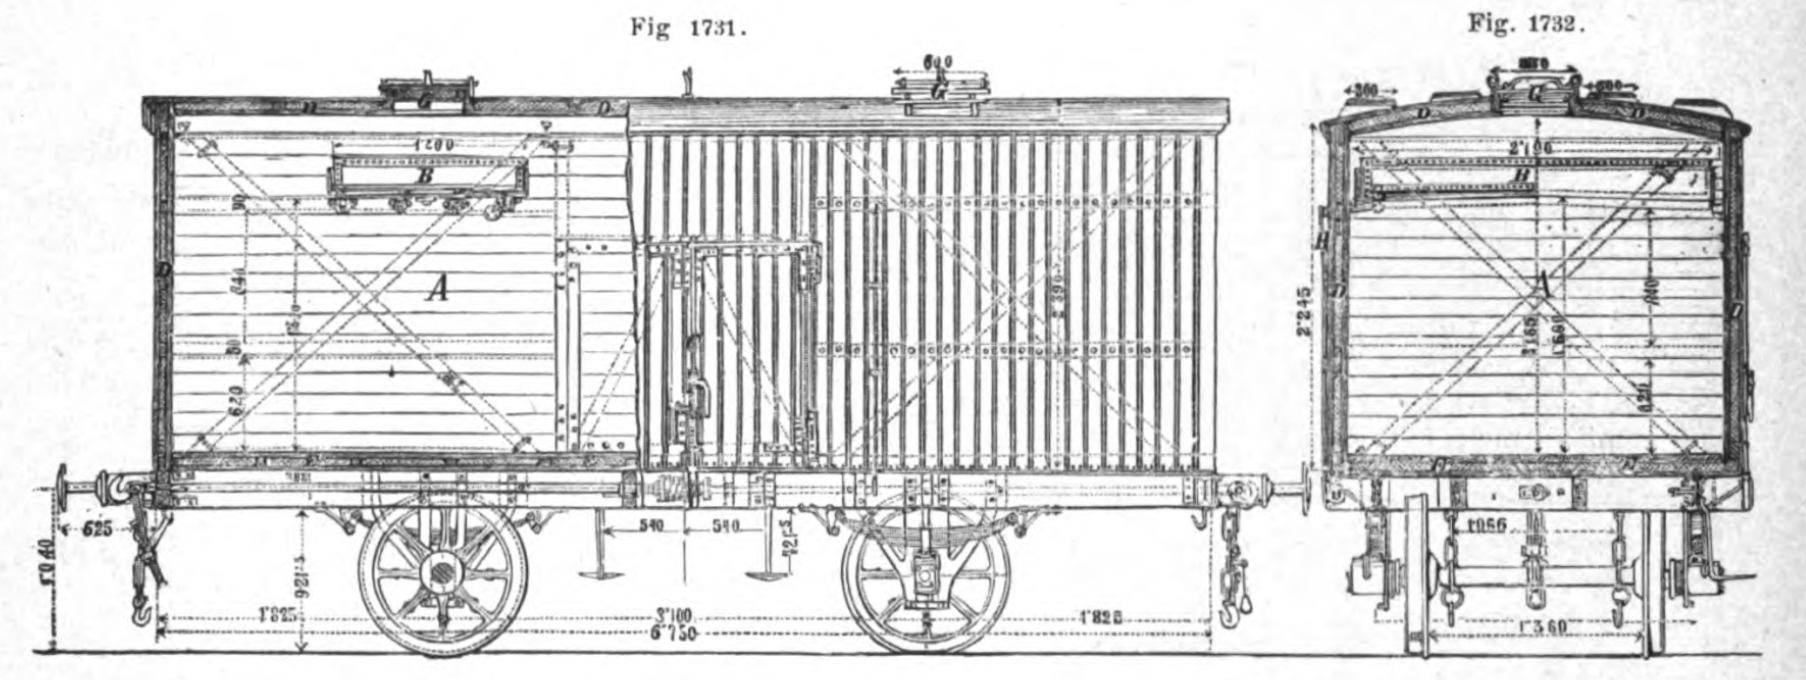
Technical drawing of the Ringhoffer beer wagon design
The construction was double boarded, and the space between the boards was filled with a poor heat conductor as insulation material. It contained 2 ice reservoirs for up to 1,100 kg of ice that could hold the inside at a constant 4°C for 5 and half days. Melted water and condensation was drained at the bottom, using a bend to ensure that no outside air could get into the sealed wagon. That way, any freight could rest on a completely dry floor. The remaining space was sufficient to transport 25 casks of 200 liters each, i.e. each wagon could hold up to 50 hl of beer at a time. This was only slightly less than the ice wagons used by Dreher, which had a capacity of 54 hl and could keep its load cool at 4°C for up to 7 days.
In terms of refrigeration at the respective breweries, all of them used Linde refrigerators. Linde had actually been contracted to develop an artificial refrigeration machine for Dreher’s Trieste brewery, and while development was done by Linde at Spaten brewery in Munich, the first Linde refrigerator was officially sold to Dreher in Trieste. In 1894, the Trieste brewery was operating two of them, while Kleinschwechat had 8 Linde refrigerators “Nr. VI” (presumably a newer model), and Steinbruch operated 6 of them. According to the article, Pilsen only operated a single Linde refrigerator, but it’s unclear which specific model.
Interestingly, the refrigeration machine the brewery in Pilsen was using had been built under license from Linde by E. Škoda, the Pilsen-based mechnical engineering company, probably best known through the Škoda car brand and the Škoda trams in Prague.
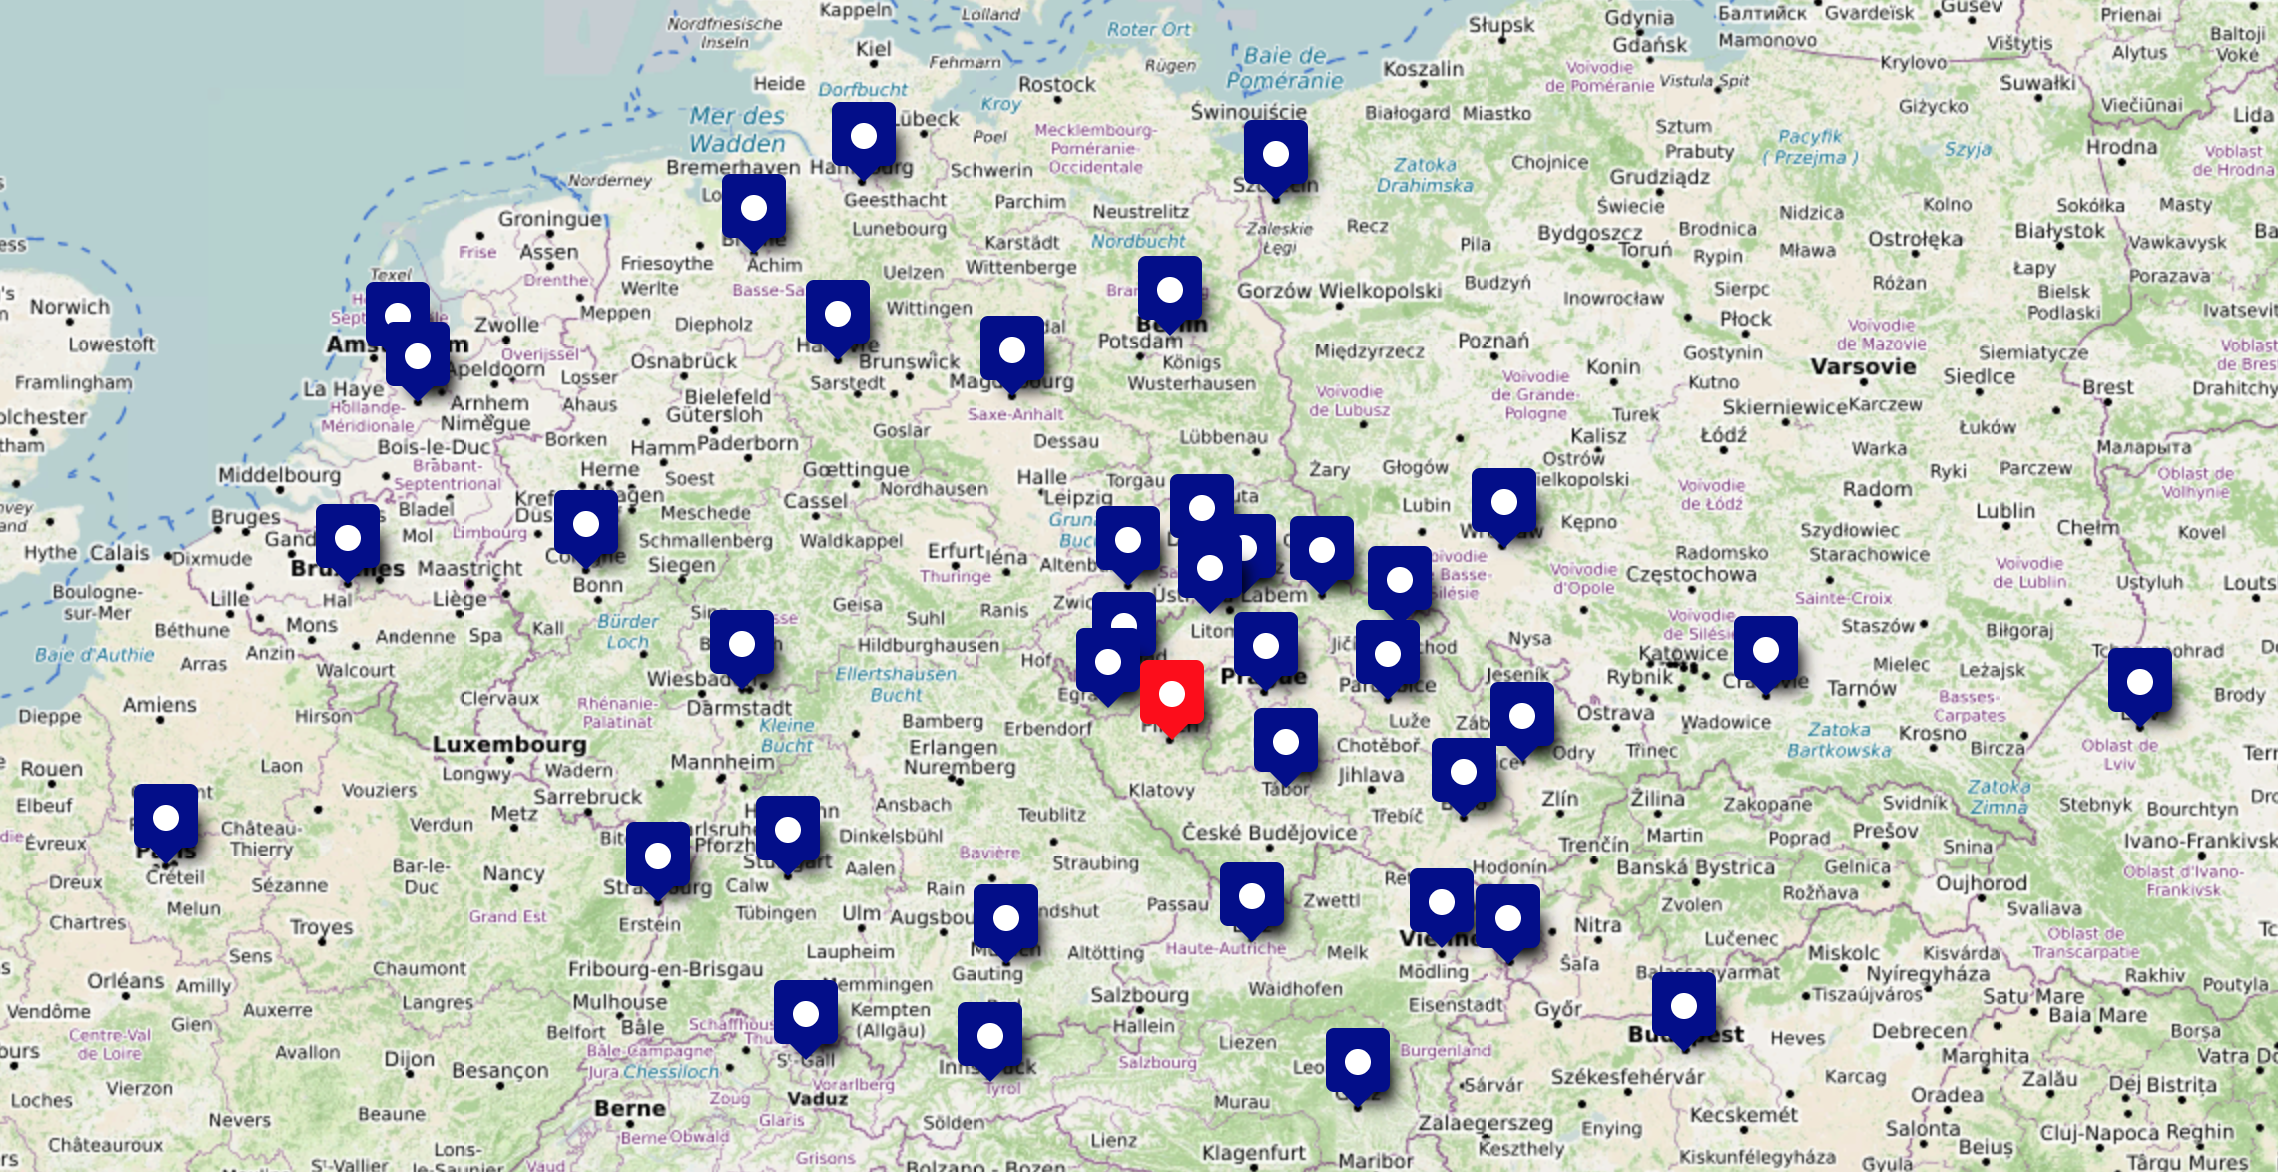
A map of Burghers’ Brewery Pilsen’s distribution centers across Europe, ca. 1894. Not pictured: Sarajevo, Belgrade
The article also lists all the distribution centers in Austria-Hungary, Germany and the rest of Europe plus one importer in New York City, which I turned into a map to get a better feeling about how widespread their beer was.
In addition to all these statistics I listed above, we also learn more details about the Burghers’ Brewery Pilsen. As you’re probably aware, the brewery was founded by the citizens of Pilsen with brewing rights in 1839. The article specifically says that it was 250 houses with brewing rights, and their duty was to elect a new administrative committee every 3 years.
We also get more insight into the beer types that were brewed at the time: as was still usual at the time, two types were produced, an 11% Schankbier (the percentage refers to the original gravity, not the ABV) that still needed 2-3 weeks of lagering before it was tapped and was brewed and sold only during the winter, and a 12% Lagerbier that was entirely free from yeast (due to the long lagering) and only sold during the summer season.
The article also discusses the modest beginnings of the brewery itself: the first brew only had a volume of 64 Eimer (3621 liter), and the total volume of the first brewing season was a mere 3657 hl. In 1843, Pilsen had a population of 8,892, that’s just a bit more than 41 liters per capita. Could it be that the amount of beer produced by the Burghers’ Brewery was initially not nearly enough to cover the demand of consumers?
In any case, the business grew so well over the years that Burghers’ Brewery Pilsen grew to a size similar to Dreher’s Kleinschwechat brewery. While the production volume was still smaller in 1894, it seems like the Pilsen brewery was prepared much better for export across Europe. By 1912, Pilsner Urquell produced almost 1 million hl of beer per year and was considered to be Austria’s largest brewery, while Dreher Kleinschwechat was “only” producing 594,865 hl in 1912 and about 621,398 hl in 1913.
If you want to learn more about Vienna Lager and the history of Dreher’s breweries in Kleinschwechat and elsewhere, you can find more about the topic in my book Vienna Lager.
